> ## Documentation Index
> Fetch the complete documentation index at: https://help.flowforth.co/llms.txt
> Use this file to discover all available pages before exploring further.
# Home Dashboard
> Get a quick overview of your email performance and recent activity.
The dashboard is the first thing you see when you log into Flowforth. It gives you a snapshot of how your emails are performing, what's been happening recently, and quick shortcuts to get started on your next email.
***
## Metrics Overview
At the top of the dashboard, you'll see four key metrics for your organization:
* **Emails Sent**: The total number of emails delivered during the selected time period.
* **Open Rate**: The percentage of recipients who opened your emails.
* **Click Rate**: The percentage of recipients who clicked a link in your emails.
* **Unsubscribes**: The number of people who unsubscribed during the selected time period.
### Filtering by Time Period
You can adjust the time period for your metrics using the filter at the top of the dashboard. Choose from:
* **24 Hours**
* **7 Days**
* **30 Days**
* **Year**
* **All Time**
This lets you zoom in on recent performance or look at longer-term trends.
***
## Performance Over Time
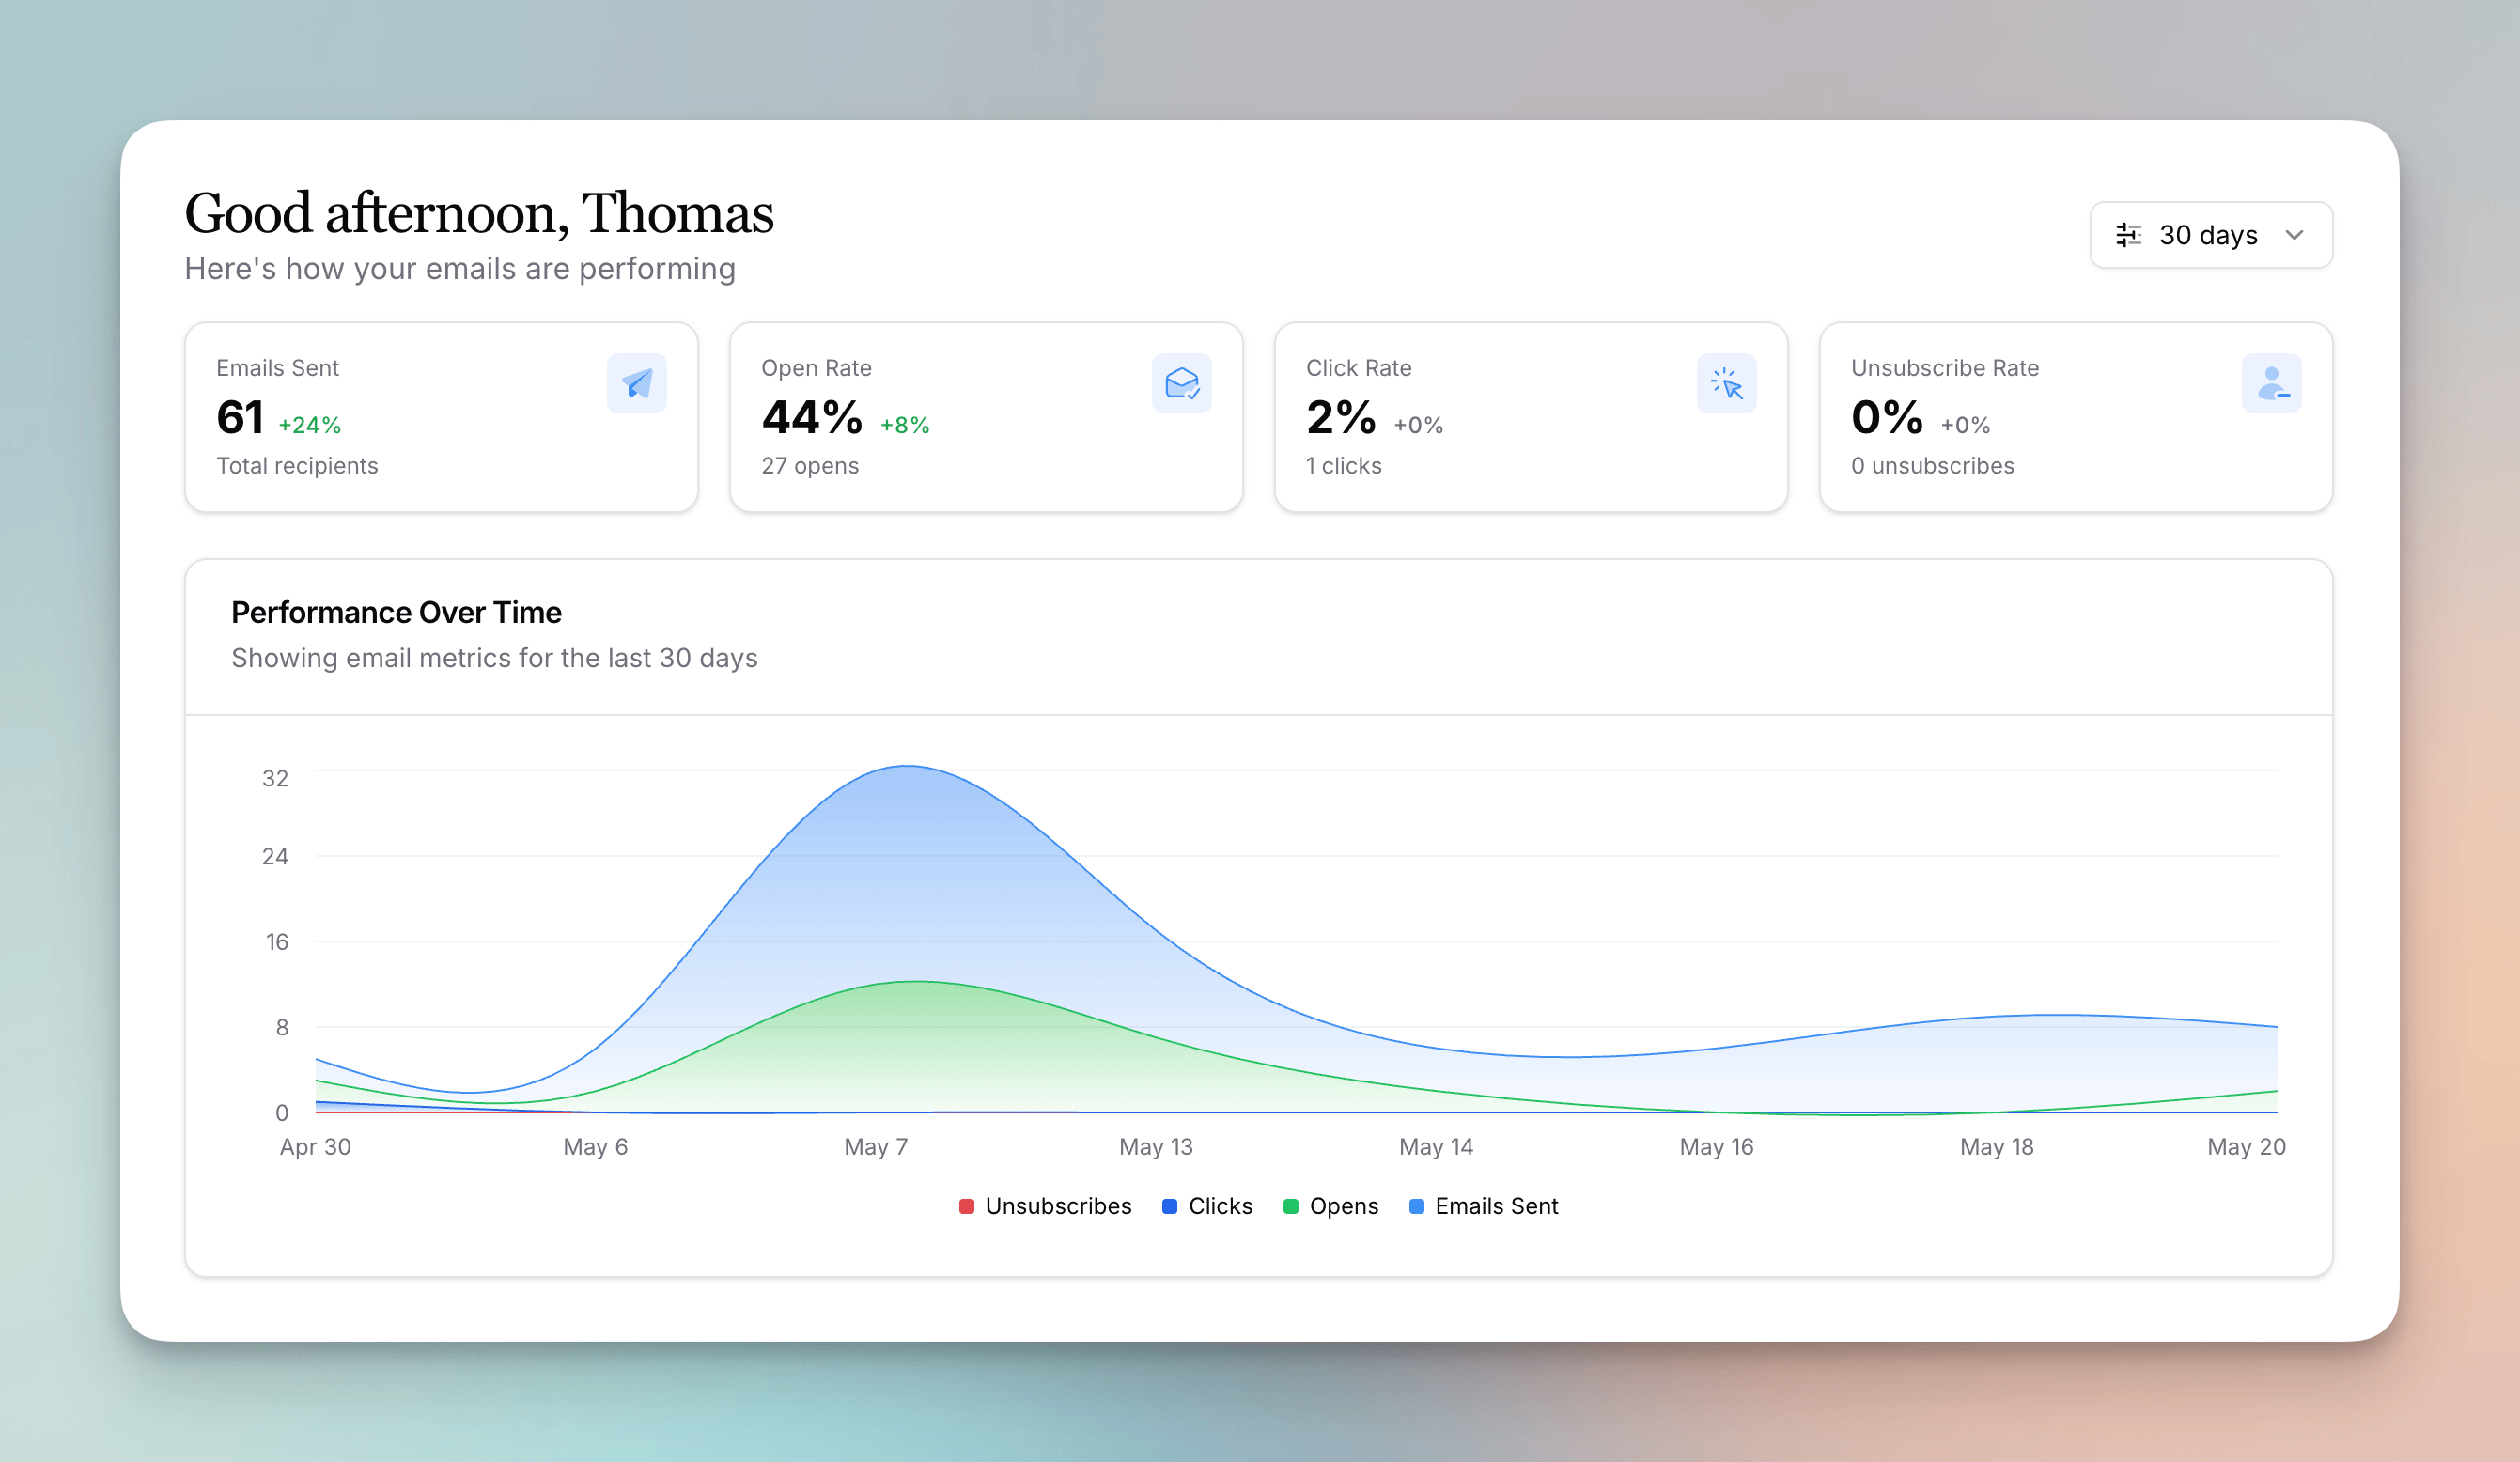 The **Performance Over Time** chart gives you a visual breakdown of your email activity over the selected time period. It tracks:
* **Emails Sent**
* **Opens**
* **Clicks**
* **Unsubscribes**
This makes it easy to spot trends and see how your engagement is changing over time.
***
## Recent Emails
The dashboard displays your most recent emails, including drafts, scheduled emails, and sent emails. This makes it easy to pick up where you left off or check the status of a recent send.
You can also start a new email or a new email template directly from the dashboard using the quick create options.
***
## Email Usage Tracker
The dashboard shows how many email sends you've used in your current billing cycle and how many you have remaining. This helps you plan your sending and avoid running out of sends before your cycle resets.
***
## Recent Unsubscribes & Bounces
This card shows your most recent unsubscribe and bounce events. Each entry includes:
* The **person's name and email**
* The **event type** (bounce, unsubscribe, or category unsubscribe)
* The **email or automation** that triggered it
* The **category name** if it was a category unsubscribe
You can click **Details** on bounce events to see more information about why the bounce occurred.
Click the link at the bottom of the card to view the full [People Feed](/people/feed) with filtering and infinite scrolling.
***
## Hiding Emails from Global Metrics
If you send a one-off email that you don't want to affect your overall stats, you can hide it from your global metrics. See [Archiving Emails vs. Hiding from Global Metrics](/emails/archiving-and-global-metrics) for step-by-step instructions and how this differs from archiving.
***
Need help with your dashboard? Contact [support@flowforth.co](mailto:support@flowforth.co).
The **Performance Over Time** chart gives you a visual breakdown of your email activity over the selected time period. It tracks:
* **Emails Sent**
* **Opens**
* **Clicks**
* **Unsubscribes**
This makes it easy to spot trends and see how your engagement is changing over time.
***
## Recent Emails
The dashboard displays your most recent emails, including drafts, scheduled emails, and sent emails. This makes it easy to pick up where you left off or check the status of a recent send.
You can also start a new email or a new email template directly from the dashboard using the quick create options.
***
## Email Usage Tracker
The dashboard shows how many email sends you've used in your current billing cycle and how many you have remaining. This helps you plan your sending and avoid running out of sends before your cycle resets.
***
## Recent Unsubscribes & Bounces
This card shows your most recent unsubscribe and bounce events. Each entry includes:
* The **person's name and email**
* The **event type** (bounce, unsubscribe, or category unsubscribe)
* The **email or automation** that triggered it
* The **category name** if it was a category unsubscribe
You can click **Details** on bounce events to see more information about why the bounce occurred.
Click the link at the bottom of the card to view the full [People Feed](/people/feed) with filtering and infinite scrolling.
***
## Hiding Emails from Global Metrics
If you send a one-off email that you don't want to affect your overall stats, you can hide it from your global metrics. See [Archiving Emails vs. Hiding from Global Metrics](/emails/archiving-and-global-metrics) for step-by-step instructions and how this differs from archiving.
***
Need help with your dashboard? Contact [support@flowforth.co](mailto:support@flowforth.co).